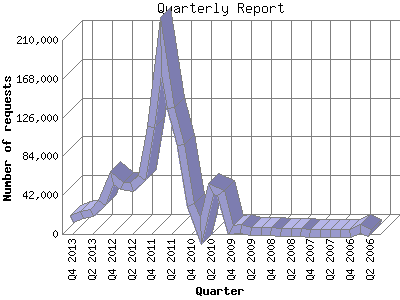
The Quarterly Report shows total activity on your site for each quarter of a
year. Remember that each page hit can result in several server requests as the
images for each page are loaded.
Note: Most likely, the first and
last quarters will not represent a complete quarter's worth of data, resulting
in lower hits.
| Quarter | Number of requests | Number of page requests | |
|---|---|---|---|
| 1. | Q2 2006 | 937 | 303 |
| 2. | Q3 2006 | 5,068 | 792 |
| 3. | Q4 2006 | 1,573 | 540 |
| 4. | Q1 2007 | 1,431 | 498 |
| 5. | Q2 2007 | 1,420 | 502 |
| 6. | Q3 2007 | 1,212 | 565 |
| 7. | Q4 2007 | 1,255 | 628 |
| 8. | Q1 2008 | 1,682 | 594 |
| 9. | Q2 2008 | 1,647 | 583 |
| 10. | Q3 2008 | 2,697 | 825 |
| 11. | Q4 2008 | 3,024 | 859 |
| 12. | Q1 2009 | 3,634 | 1,054 |
| 13. | Q2 2009 | 3,523 | 1,318 |
| 14. | Q3 2009 | 4,930 | 1,555 |
| 15. | Q4 2009 | 3,998 | 1,136 |
| 16. | Q1 2010 | 44,713 | 4,784 |
| 17. | Q2 2010 | 48,378 | 3,508 |
| 18. | Q3 2010 | 3,467 | 114 |
| 19. | Q4 2010 | 30,853 | 2,370 |
| 20. | Q1 2011 | 96,052 | 5,106 |
| 21. | Q2 2011 | 135,867 | 4,777 |
| 22. | Q3 2011 | 203,859 | 4,920 |
| 23. | Q4 2011 | 116,061 | 5,125 |
| 24. | Q1 2012 | 61,153 | 4,804 |
| 25. | Q2 2012 | 50,919 | 5,155 |
| 26. | Q3 2012 | 52,380 | 5,023 |
| 27. | Q4 2012 | 60,950 | 6,575 |
| 28. | Q1 2013 | 33,696 | 22,232 |
| 29. | Q2 2013 | 22,544 | 21,530 |
| 30. | Q3 2013 | 21,104 | 19,883 |
| 31. | Q4 2013 | 16,778 | 16,037 |
Most active quarter Q1 2013 : 22,232 pages sent. 203,859 requests handled.
Quarterly average: 4,635 pages sent. 33,445 requests handled.
This report was generated on November 25, 2013 21:10.
Report time frame June 9, 2006 02:34 to November 25, 2013 23:36.
| Web statistics report produced by: | |
 Analog 5.1 Analog 5.1 |  Report Magic 2.21 Report Magic 2.21 |